Your time-series analysis in 5 steps
Machine learning is a hotter topic now more than ever, and as a data engineer, you want to be a part of it. You’ve followed a few courses here and there and kept up as much as possible with advances in the field. You have access to a great dataset and decided to start a project of your own. Yet things started going south right from the beginning: your time series model just wasn’t as promising as you’d hoped.
Ezako is here to help! Below are five brief steps to help you build your time series model. Feel free to use it as a quick cheat sheet to check you haven’t forgotten anything important.
1. Data preparation
You wouldn’t cook your favourite meal with dull knives and dirty pans, so why botch your data preparation before modelling? Data cleaning and preparation is perhaps the most vital step for creating your time series model. Don’t be startled, though: this isn’t always a painful procedure and may be simpler than you think.
Data selection
Start by collecting and selecting your data. You need to have enough raw data for your project, but only keep the parts which are actually relevant to you. A good selection of your data is fundamental for the success of your project since getting rid of unwanted noisy data can only improve the performance of your model and save you the cost of storing useless data.
Formatting
Raw data comes in all shapes and sizes but these may not be the ones you wish to work with. Here’s where the (re)formatting phase starts: taking your raw data and converting it into your favourite storage type. Plain text and CSV files might cut it, but have you thought about more complex databases with tables, keys and relations that might better accommodate your data as it grows, such as InfluxDb, QuasarDb, or KDb+ ?
Data Cleaning
We’re almost done preparing our data! The last step is to clean it. You’ve selected the right data and converted it into an ideal type, but your data still isn’t perfect. For instance, there might be missing values or outliers that should be dealt with. The choice here is up to you: do you keep these values as is? Do you remove whole entries where these kinds of observations appear? Do you fill them in with new data?
Be careful though, as missing values or outliers could actually be points of interests and not simply statistical errors. Anomaly detection is a Machine Learning field by itself, which tells us that data cleaning isn’t a straightforward task and requires careful investigation.
2. Data exploration
I can already tell you’re ready to leap into the creation of your model, but hold your horses! A great practice at this stage is to explore your data by visualizing it. This seems so obvious, but I have seen many data scientists not even knowing blatant trends and patterns about their data. For instance, stationarity is very easy to detect on a graph, and in many cases so is seasonality. Basic statistics about data repartition also give a decent understanding of data distribution. In the case of high dimensionality, visualization is still possible through various techniques such as histograms, heatmap correlation plots, data projection into components, or parallel coordinates plots.
Now, this only takes a few moments to set up, but could already save tremendous headaches as to why your model isn’t behaving the way it should. Save yourself some sweat and plot your data!
3. Data modelling
You first need to have a goal. There are many different machine learning models, and the one you choose will above all depend on your data and what your goal is. Your analysis will probably not be the same if you want to predict stock market value or detect an anomaly in an autonomous car.
Once you have clearly defined your objective, you need to choose an appropriate approach. Do you only need to identify similarities or recurring patterns in your data to make predictions? Then go for some unsupervised models. Or is your data labeled and need to tackle classification or regression problems where the outcome is known beforehand? If labeled, then supervised algorithms will be your best option. The amount of content available to help you choose an appropriate algorithm for your problem is more than enough and maybe overwhelming. Don’t worry if you don’t choose the best of the best, and don’t be fooled by fancy models such as LSTM: a good baseline is a perfect starting point for improvement.
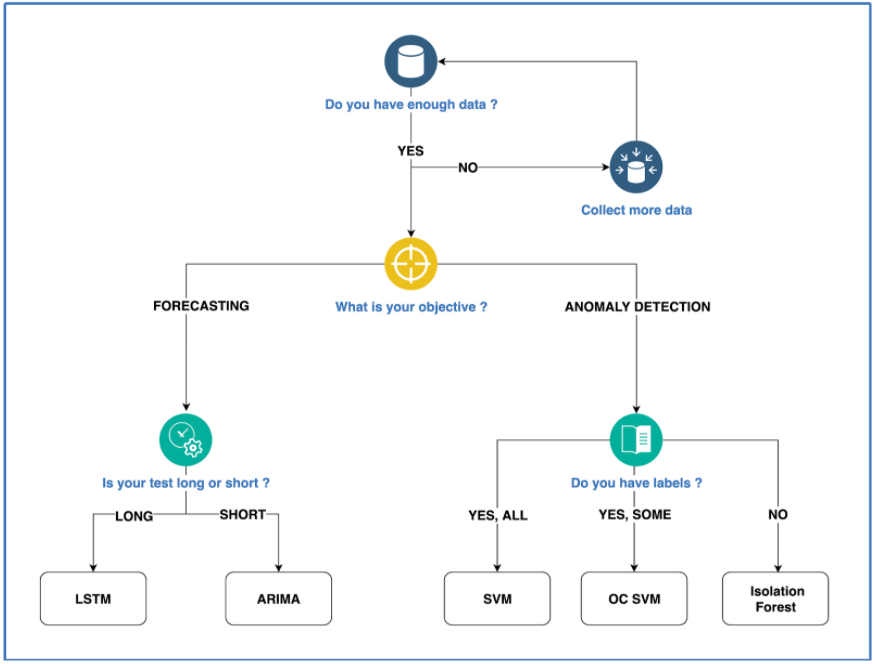
If you are not clear with the option to choose, don’t be afraid to keep it simple. Having many hyperparameters to define and optimize usually makes the situation more complex than it needs to be. For instance, for a time series anomaly detection, you could go for a standard isolation forest with low contamination to start with, before trying a deep learning algorithm.
4. Performance evaluation
You’ve chosen your model and ran it, but your work isn’t quite over yet. Between model tuning and performance optimization, now is your time to shine as a data scientist. It’s likely you’ll evaluate your model several times and will therefore need to design a performance framework. Such a framework requires you for instance to consider how to measure your model’s performance or how to select training and testing data. This all depends on what you want to achieve: do you wish to track accuracy or mean square errors?
Then comes the time for cross-validation. The idea is to divide your data into several sets (or folds) and train your model on all of these sets except one, used for testing. Repeat the process until you have tested every fold and measured all of your indicators. As a rule, data sets are generally divided into 5 or 10 folds for satisfactory results. Cross-validation is a great way to train and test all of your data without running into overfitting problems.
Evaluating performance isn’t only about optimizing your model. By benchmarking several features, models or even datasets, this step is about getting the best results from all of your machine learning processes.
5. Export to production
Almost done now! You’ve created your model and evaluated its performance, all is left is to export it to production. Usually, “export” is much more than actually exporting an algorithm. If this is a personal project, it’s likely you may not need to do anything at all. If not, depending on the target infrastructure, you may need to rewrite the code in the actual language used in production. AWS EC2 is a great way to access the type of infrastructure you need, but dedicated machine learning services such as Microsoft Azure help you bootstrap faster at the cost of limited possibilities. A more elegant solution could be to containerize your solution (with Docker, for example) as you will not be limited by the system or physical requirements. Last, you can use Upalgo as a way to create and put in production your algorithms.
Conclusion
And there you have it! Creating a time series model isn’t the most straightforward process out there, but keep trying to improve your model and hone your technique: you’ll get much better in no time.
Be sure to check out Ezako’s whitepaper on this subject, where we go over this process in more detail.