Upalgo Labeling Timeseries

Time series labeling software

Upalgo Labeling Timeseries is a desktop application that lets analysts label events on multi-column sensor and measurement series. Analysts mark ranges (or points), search for similar patterns across series, validate candidates, and export labeled CSVs, all while the data remains on the local workstation. It is designed for "remaining-useful-life", "anomaly", and "regime-detection" workflows where precision and data sovereignty matter.

Upalgo Labeling Timeseries

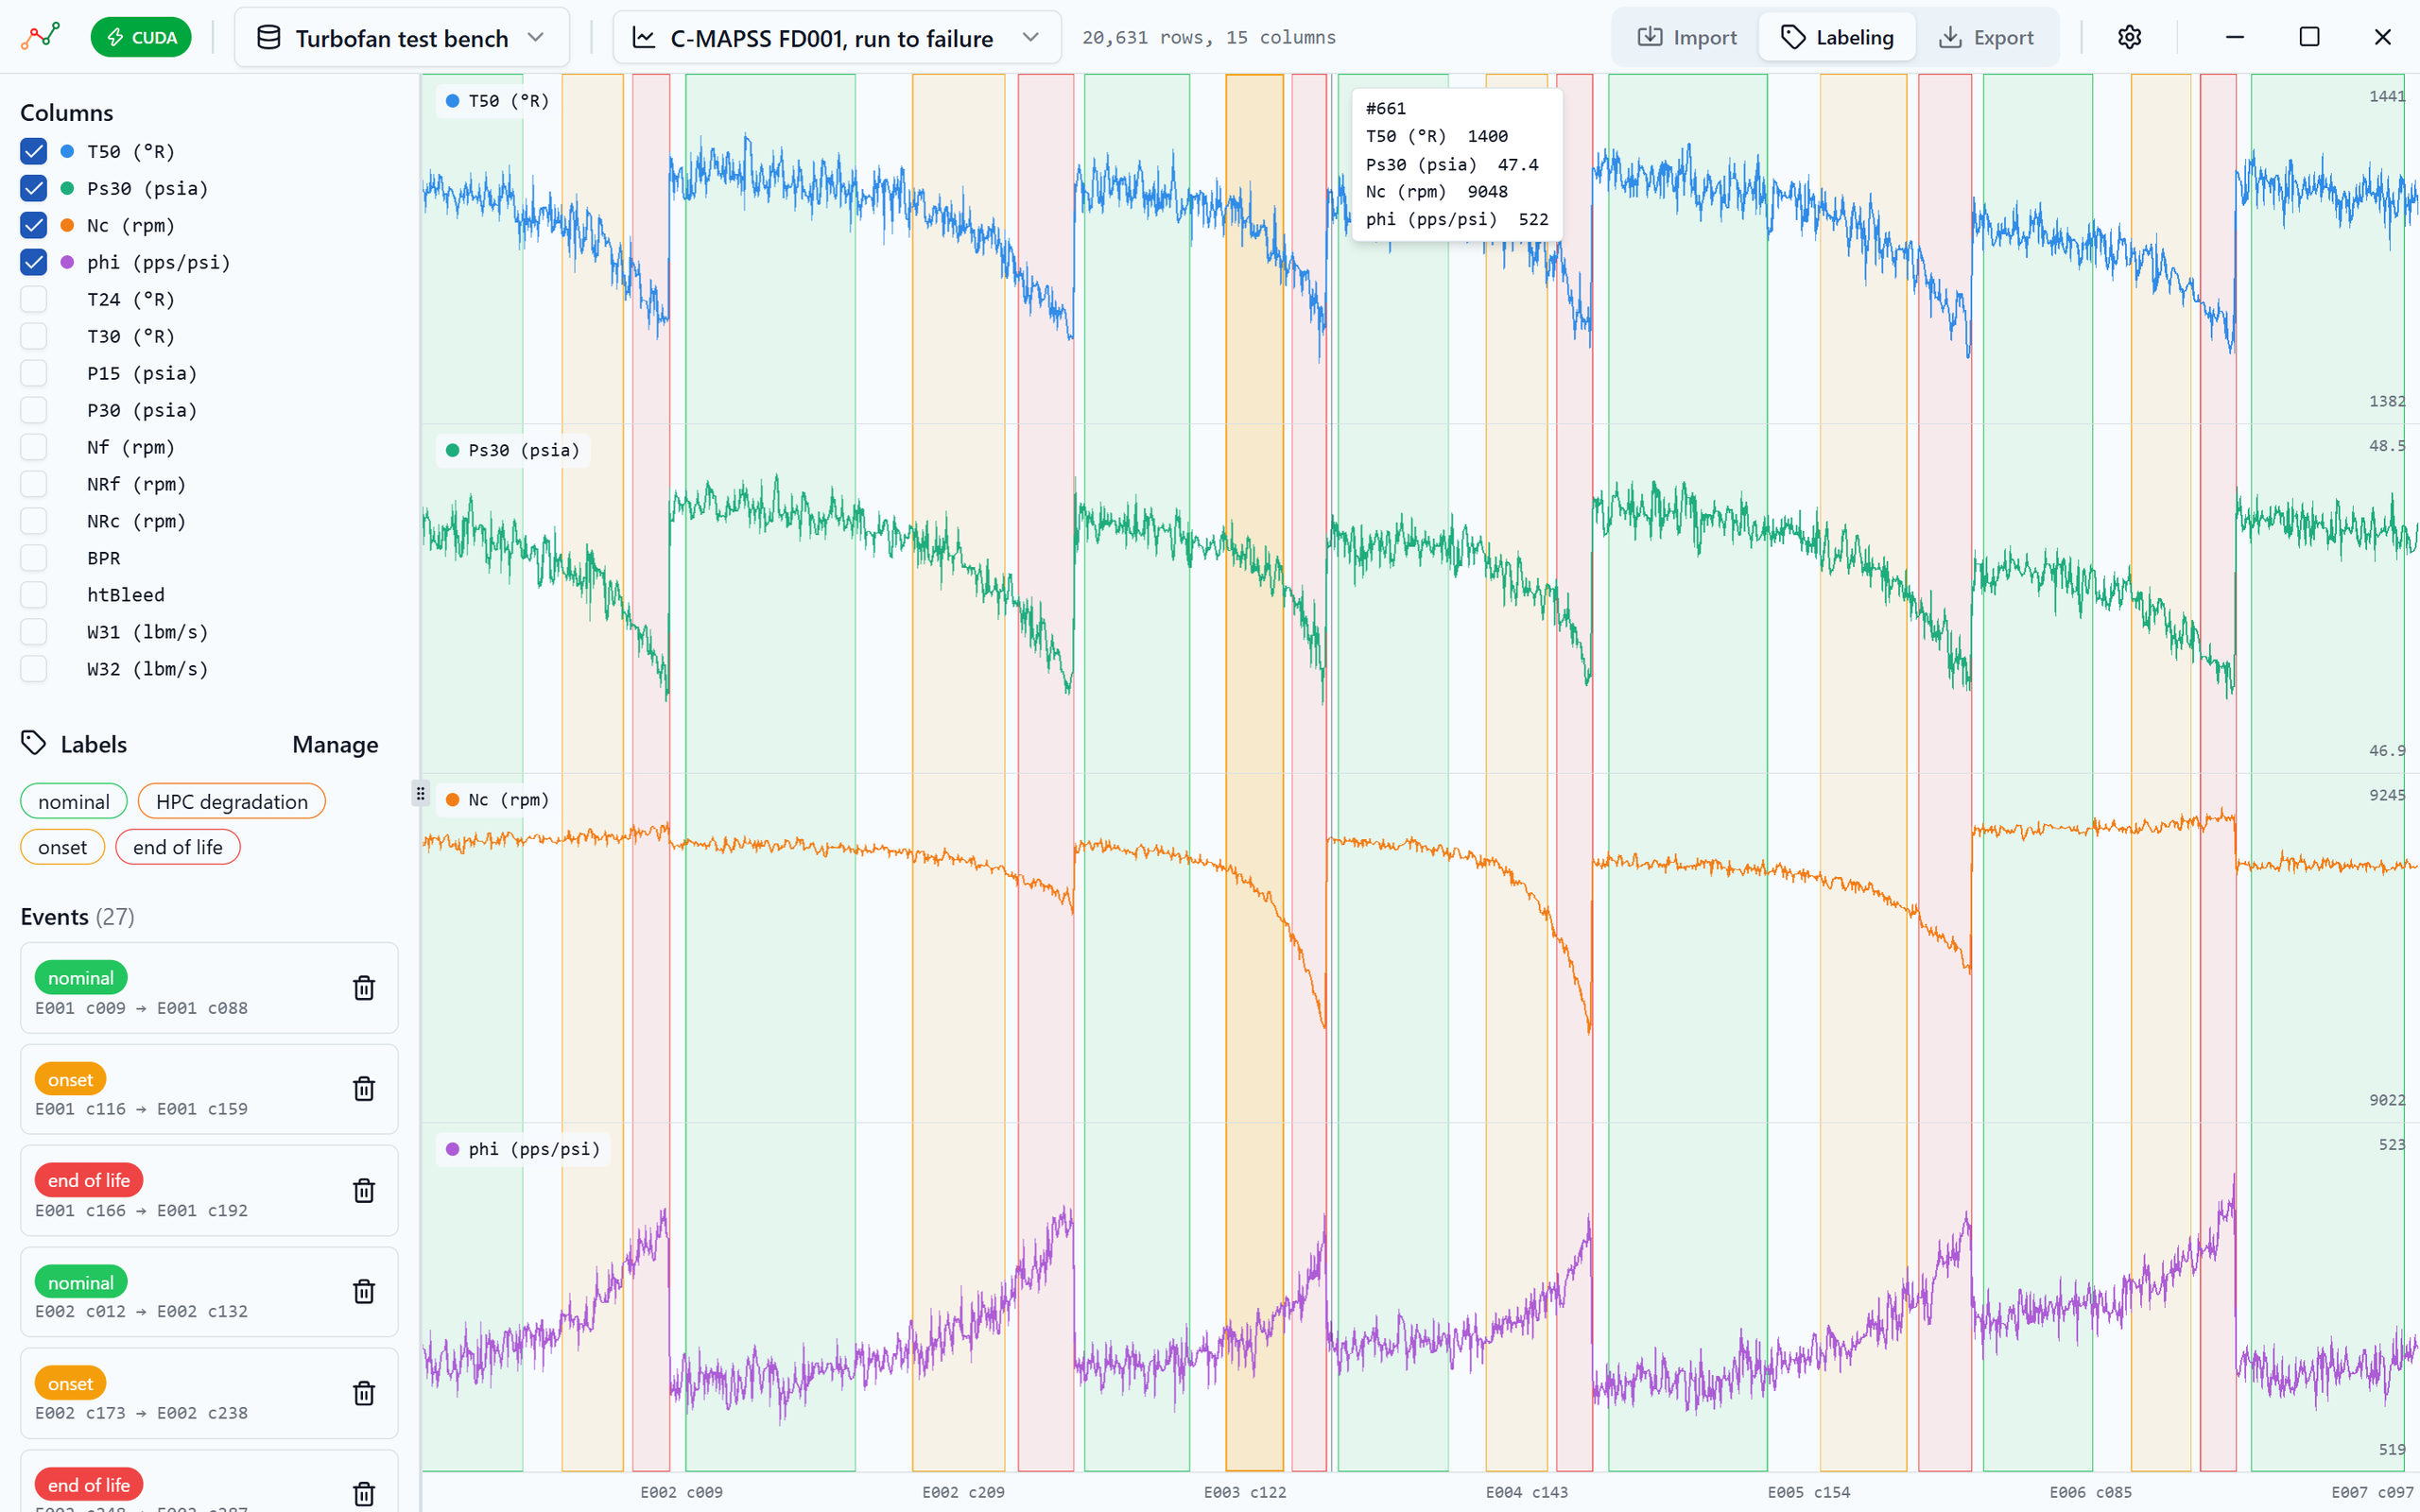
Upalgo Labeling Timeseries: four sensors of a turbofan test bench drawn one above the other across six engines run to failure, the nominal, onset and end-of-life ranges coloured on the chart, one range selected, the list of columns, labels and events on the left, and the values under the cursor.
  1. The columns of the file; each one drawn has its own lane and its own scale.
  2. A labeled range, in the colour of its label, across every column.
  3. Under the cursor: the row and the value of each column.
  4. The labels, in a hierarchy, and the events of the series with their bounds; selecting one brings it into view.
Six turbofan engines run to failure, labeled on NASA’s C-MAPSS simulation data, a public dataset.

Capabilities

  • Import

    CSV files with a configurable separator, decimal mark and header; one or several index columns, timestamps or not; one file split into several series by an identifier column; an existing label column read as events.

  • Display

    Several columns on one chart, on a common or an independent scale; zoom from the whole series down to the sample, on a multi-resolution storage; two series side by side, or one column compared across series.

  • Annotation

    Events as ranges or single points, drawn on the chart or entered by their bounds; hierarchical labels with their colours; search and preview of the events of a series.

  • Similar patterns

    From a labeled event, search for the ranges that resemble it, on one or several columns and across series; each result carries a score and is reviewed by the analyst before it receives a label.

  • Label candidates

    Rare patterns of a column proposed as candidates, scored, and submitted to the analyst for validation, keeping the human in the loop.

  • Computed columns

    Combination of columns, derivative, low-pass denoising, normalisation, and the remaining time before a labeled event, the target of a remaining-useful-life model.

Specifications

Input formatCSV, UTF-8; separator, decimal mark, header and index configurable
IndexTimestamps or any other index, on one or several columns; the row number otherwise
Series per fileOne, or up to 1,000 with an identifier column
LabelsCSV export per series or per project, with a label column; label hierarchy exported and imported in CSV
PlatformsWindows, macOS, Linux
ProcessingOn the workstation

See what Ezako can do with your data

Describe your signals and your requirements to arrange a demonstration.